
An initial economic assessment of the Palo Alto Networks Securities Litigation
Introduction
This post contains a preliminary assessment of the Palo Alto Networks Securities Case (5:24-cv-01156). The article discusses the potential damages in the case, the market efficiency indicators for the company, various loss causation issues, and potential settlement ranges.
This article is part of a series of semi-standardized preliminary economic analyses of recently filed cases. In separate publication I described the potential benefits from standardizing some preliminary case assessments. The opinions expressed are those of the author only and do not necessarily reflect the views of their company, employer, or its clients. This article is for general information purposes and is not intended to be and should not be taken as legal advice or used an expert opinion. All tables and charts sourced from SCA iPortal are published with permission.
Summary of the Case
Palo Alto Networks (“PANW”) is a cybersecurity firm providing network security, cloud security, security operations and threat Intelligence and security consulting. The complaint alleges that company and its management committed violations of §10(b) of the Exchange Act.
The specific allegations are that PANW and its management made false statements and failed to disclose material facts regarding their market share, platformization initiatives, billings sustainability, and AI offerings.
There is only 1 curative disclosure – the February 20, 2024, earnings release and guidance. According to the complaint, after the market closed on February 20, 2024, PANW “drastically reduced its billings guidance for the third quarter, reporting expected total billings growth of 2-4% and revenue growth of between 13% and 15%” and announced that “U.S. federal government deals for several large projects did not close and resulted in “a significant shortfall in [PANW’] U.S. federal government business.””
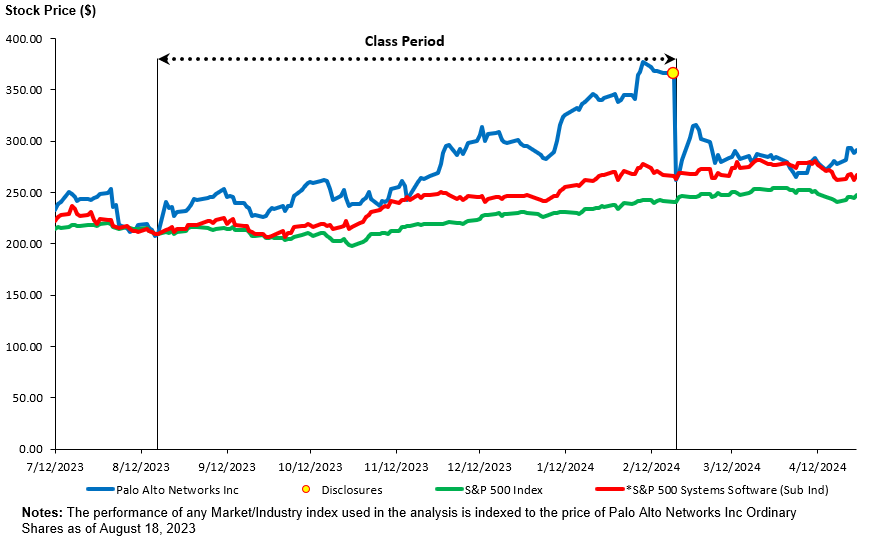
The class period is from August 18, 2023, and February 20, 2024.
Figure 1: Palo Alto Networks Class Period (SCA iPortal)
Damages
Figure 2: Plaintiff-Style Aggregate Damages (SCA iPortal)
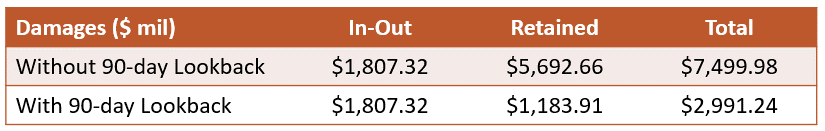
The plaintiff style aggregate damages are computed subject to a number of assumptions. See the Appendix below.
Discussion
The most likely aggregate damage estimate in the case is in the order of $3 billion. It can vary somewhat depending on various assumptions used. Some relevant facts are as follows:
The single corrective disclosure on February 20, 2024 (after market close) resulted in a market capitalization decline of over $33 billion. See Figure 1. This is approximately equal to 323 million outstanding shares declining by $104.12 each. This magnitude, though quoted in contemporaneous announcements of investigations of securities law violations, is not a supportable damage number as described below.[1] It is shown as a benchmark for comparison only.
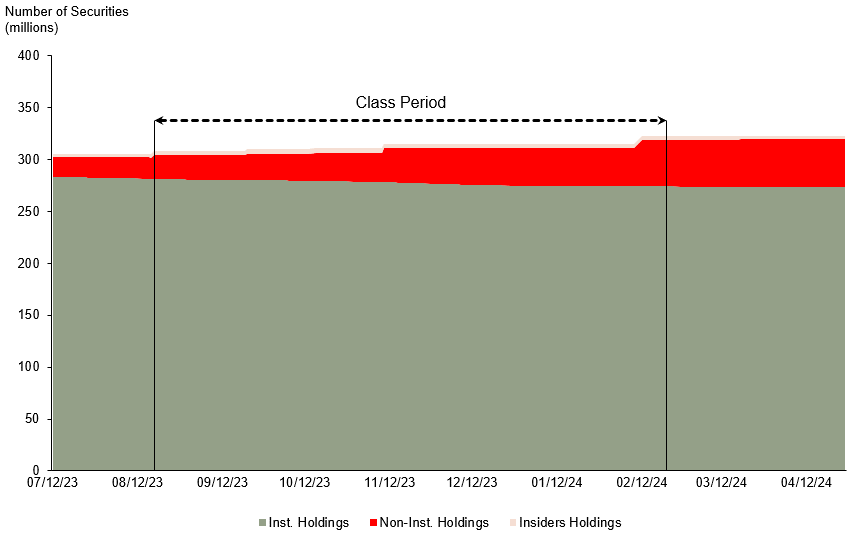
The aggregate damages “Without 90-day Lookback Cap” (see Figure 2) are $7.5 billion. The number is roughly equal the product of $103.22 damage per share and approximately 73 million damaged shares. The number of damaged shares is significantly lower than the total number of shares outstanding, reflecting the short length of the class period and traded volume in that period, and the significant institutional holdings that did not trade in the class period (see Figure 3).
Figure 3: Insider and Strategic Investor Shares (SCA iPortal)
The aggregate damages “With 90-day Lookback Cap” (see Figure 2) applies an upper limit to the $103.22 damage per share as stipulated in the PSLRA.[2] The upper limit is the difference between the purchase price and the average prce for up to 90 days after the end of the class period. The limit is significantly smaller than the $103.22 damage per share as a result of the gradually rising stock price of PANW over the class period.
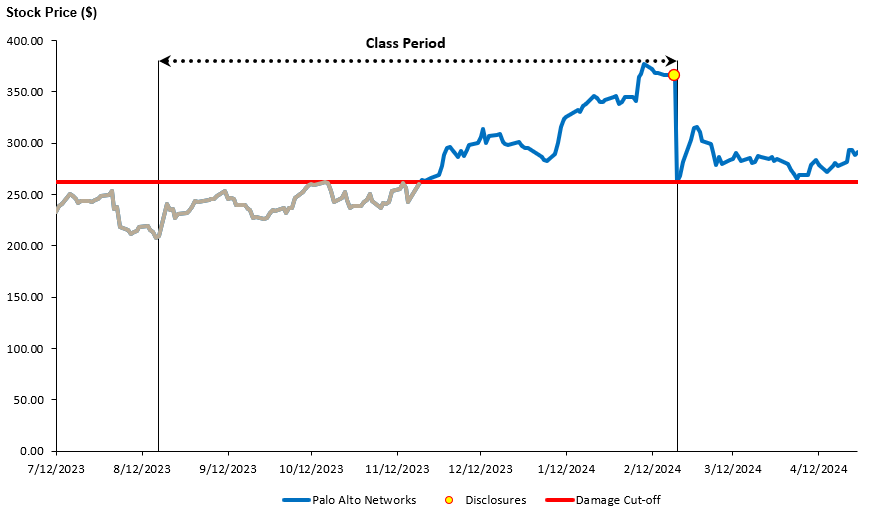
An observant reader may notice that the application of 90-day lookback provision reduces damages by more than 50% despite the fact that the rebound in the stock price after the class period was not nearly as significant (in Figure 4 or Figure 1). The reason, as mentioned above, is that even without a significant price rebound, the 90-day lookback provision can limit the damages on shares retained at, or sold after, the end of the class period when the price has an upward trajectory during the class period. As Figure 4 shows, any investor who purchased before November 21, 2023, and retained or sold their shares after the class period would realize a trading gain. Moreover, some investors who purchased after November 21, 2023, would also have losses much smaller than the damage per share computed from the decline on February 21, 2024. In other words, the 90-day lookback cap effectively shortens the class period to start at November 21, 2023, and reduces the damage per share for many investors except for those who purchased near the peak during the class period.[3]
Figure 4: Effect of 90-day Lookback Cap on Damaged Shares (SCA iPortal)
Class Certification – Market Efficiency
Defendants usually face an uphill battle in fighting market efficiency on US exchange listed securities. PANW is not an exception to that rule. In this post I publish the most common tests of market efficiency used in Section 10(b) cases. I cite the test and the corresponding numeric values, and compare those value to benchmarks provided in a paper by Bhole, Surana and Torchio (2020).[4]
Note that the authors of the paper propose, without supporting analysis, that a factor which is above the 10th percentile for all stocks in the direction required for efficiency should be considered to be indicative of efficiency. For example, if the Cammer turnover statistic for AXTI is higher than the turnover of 10% of the US-listed securities, then Bhole, Surana and Torchio (2020) argue that it should be considered supportive of market efficiency.
Cammer Factors:
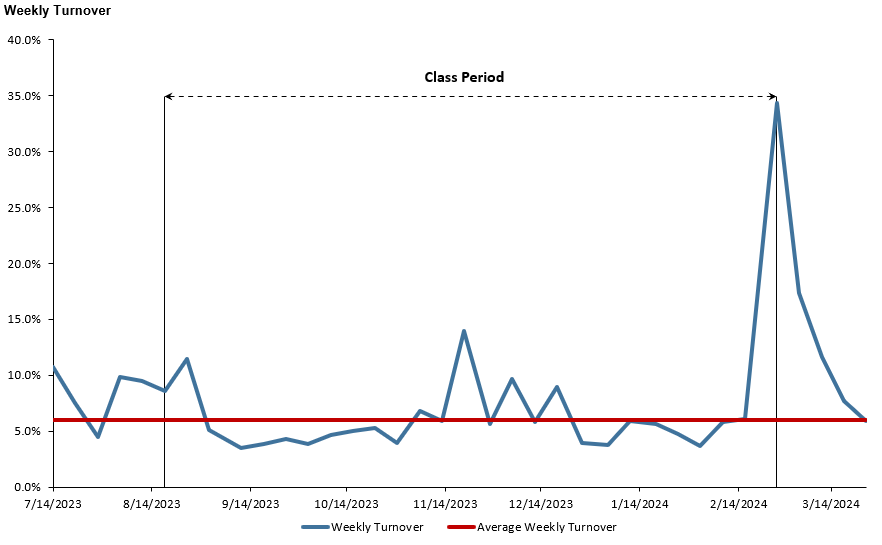
Cammer 1: Weekly Volume Turnover
Purpose: According to Cammer v Bloom “[t]he reason the existence of an actively traded market, as evidenced by a large weekly volume of stock trades, suggests there is an efficient market is because it implies significant investor interest in the company.” The decision states that “turnover measured by average weekly trading of 2% or more of the outstanding shares would justify a strong presumption that the market for the security is an efficient one; 1% would justify a substantial presumption.”[5]
Result: The average ratio of weekly trading volume to securities outstanding over the Class Period is 5.99. This is well over the 95th percentile among US listed stocks.
Figure 5: Weekly Trading Volume (SCA iPortal)
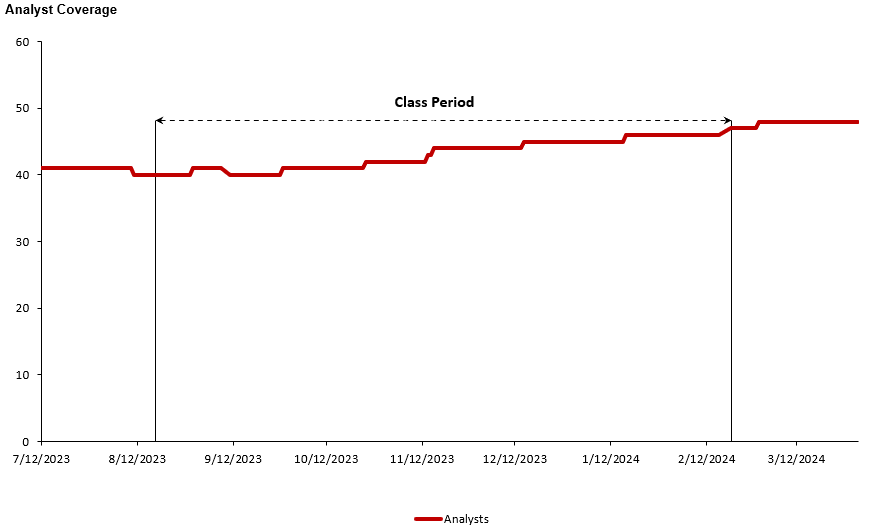
Cammer 2: Number of Analysts Following the Stock
Purpose: According to Cammer v Bloom, “it would be persuasive to allege a significant number of securities analysts followed and reported on a company’s stock during the class period. The existence of such analysts would imply, for example, the [company’s] reports were closely reviewed by investment professionals, who would in turn make buy/sell recommendations to client investors.”[6]
Result: The average number of analysts covering the company over the Class Period is 43. This is well over the 95th percentile among US listed stocks.
Figure 6: Number of Securities Analysts (SCA iPortal)
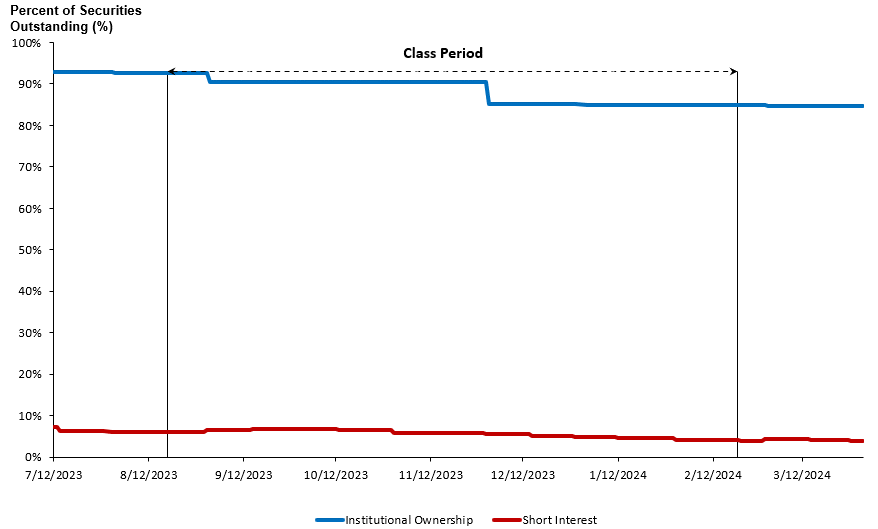
Cammer 3: Number of Market Makers
Purpose: According to Cammer v Bloom, “[t]he existence of market makers and arbitrageurs *1287 would ensure completion of the market mechanism; these individuals would react swiftly to company news and reported financial results by buying or selling stock and driving it to a changed price level.”
However, the “market makers count” was criticized for its misleading nature within just 5 years of the Cammer decision. Barber, Griffin and Lev (1993) concluded that “apparently, market makers just “make a market” in the stock, namely match buy and sell orders, without contributing to the information available about the stock.”[7] The definition of a “market maker” also differs across market structures, e.g. NYSE vs NASDAQ. As a result, economic experts have used ‘proxies’ for what the Cammer decision envisioned are “individuals would react swiftly to company news and reported financial results by buying or selling stock and driving it to a changed price level.”[8] The most common such ‘proxies’ are the percentage of institutional investors holding a security and the short interest as a fraction of the shares outstanding.
Result 1: The average percentage of PANW stock held by institutional investors during the Class Period was 88.3%. This is approximately the 75th percentile of US listed securities.
Result 2: The average short interest of PANW stock as fraction of securities outstanding during the Class Period was 5.7%. This is above the 50th percentile of US listed stocks.
Figure 7: Sophisticated Investors (SCA iPortal)
Cammer 4: Eligibility to file SEC Form S-3
Purpose: According to Cammer v Bloom, “it would be helpful to allege the Company was entitled to file an S-3 Registration Statement in connection with public offerings or, if ineligible, such ineligibility was only because of timing factors rather than because the minimum stock requirements set forth in the instructions to Form S-3 were not met.” [9]
Result: While PANW did not file a form S-3 during the class period, it was more than likely eligible to file the form. PANW’s market capitalization was far above $75 million throughout the class period (see Figure 10). The stock had traded on a US exchange for more than 12 months throughout the class period. The company was not late filing its financials throughout the class period.
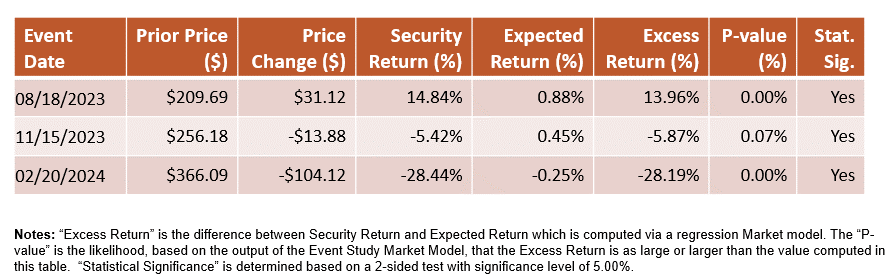
Cammer 5: Cause-and-Effect Relationship Between Material News and Stock Returns
Purpose: The Cause-and-Effect (aka Fifth Cammer) Factor is considered, by most experts and courts, the most direct test of market efficiency. Cammer v Bloom states “it would be helpful to a plaintiff seeking to allege an efficient market to allege empirical facts showing a cause and effect relationship between unexpected corporate events or financial releases and an immediate response in the stock price. This, after all, is the essence of an efficient market and the foundation for the fraud on the market theory.”[10]
There are a number of tests that can be applied to this factor. Two standardized tests are presented below:
Result 1: Percent of earnings announcements with statistically significant price reaction during the class period: 100% (3 out of 3). See Figure 8.
This is a result of an event study on the days of earnings releases by PANW during the class period. Earnings days are the most commonly used dates with potentially material new information. It should be noted, however, that the use of earnings announcements needs to be reviewed further by economic experts to determine whether the lack of statistically significant reaction to any of them is scientifically expected or surprising. Analysis needs to be conducted to determine if the earnings announcements were in line with expectations, contained earnings surprises or material new information such future guidance. This analysis will involve expert judgment.
Figure 8: Earnings Dates Event Study (SCA iPortal)
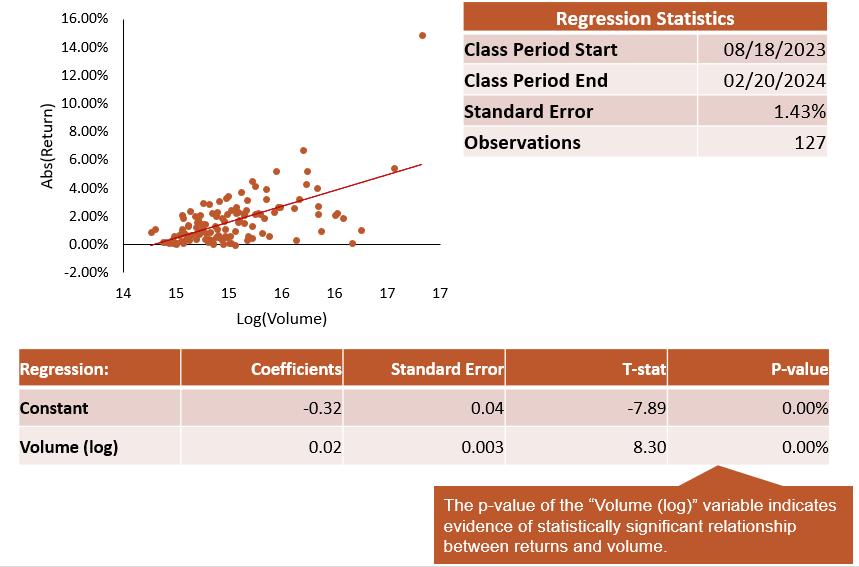
Result 2: The correlation between volume and security returns IS statistically significant. See Figure 9.
This test assumes that volume is a proxy for news flow.[11] Thus, a test of the correlation between returns and volume is arguably a test of the cause-and-effect between information flow and returns. According to Bhole, Surana and Torchio (2020), over 98% of US listed stocks exhibit statistically significant correlation between daily returns and volumes.
Figure 9: Return – Volume Regression (SCA iPortal)
Krogman Factors
Krogman 1: Market Capitalization
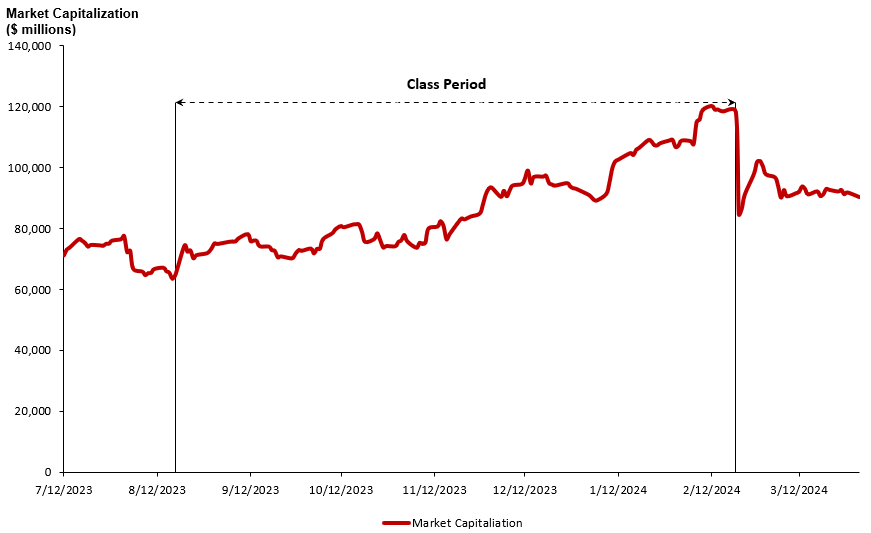
Purpose: According to Krogman v. Sterritt, “[m]arket capitalization, calculated as the number of shares multiplied by the prevailing share price, may be an indicator of market efficiency because there is a greater incentive for stock purchasers to invest in more highly capitalized corporations.”[12]
Result: The average market capitalization of PANW stock during the Class Period was $87.5 billion, though it varied between $63 billion and $121 billion. The $87.5 billion average is well above the 95th percentile of US listed stocks. See Figure 10.
Figure 10: Palo Alto Networks Market Capitalization (SCA iPortal)
Krogman 2: Bid-ask Spread
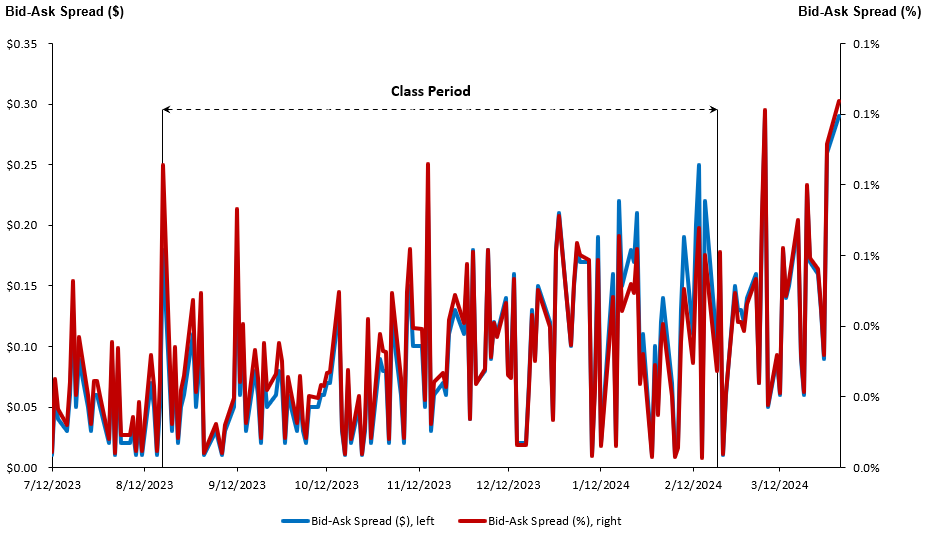
Purpose: According to Krogman v Sterritt, “A large bid-ask spread is indicative of an inefficient market, because it suggests that the stock is too expensive to trade.”[13]
Result: The average Bid-Ask Spread of a Palo Alto Networks Inc Ordinary Share was, on average, $0.09, or 0.03% of the security price. See Figure 11. An average bid-ask spread of 0.03% is below the 25th percentile of bid-ask spreads of US listed companies. (Note: For Bid-Ask spreads LOWER is better)
Figure 11: Palo Alto Networks Bid-Ask Spread (SCA iPortal)
Krogman 3: Public float
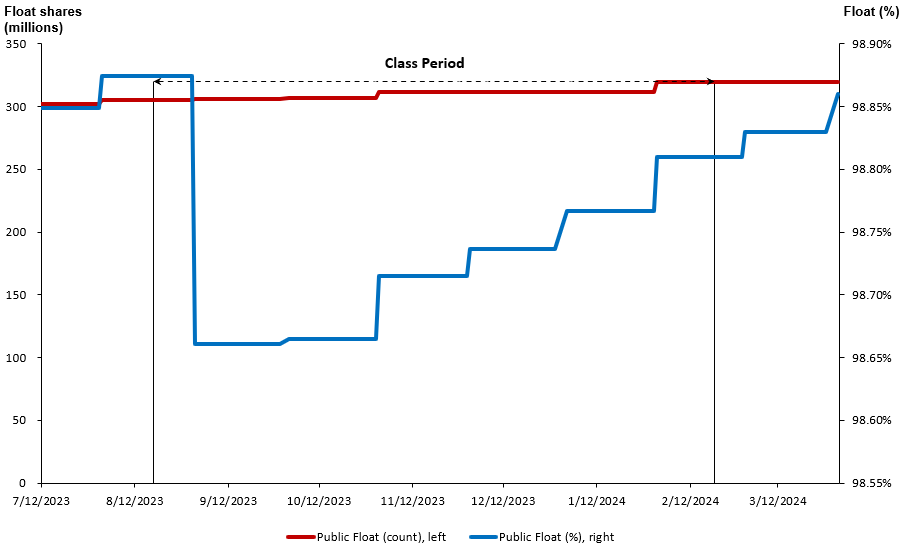
Purpose: According to Krogman v Sterritt, “Because insiders may have private information that is not yet reflected in stock prices, the prices of stocks that have greater holdings by insiders are less likely to accurately reflect all available information about the security.”[14]
Result: The average Public Float of Palo Alto Networks Inc Ordinary Shares was, on average, 310 million, or 98.7% of the outstanding securities. See Figure 12. There is no benchmark for public float shares of outstanding stock that I am aware of.
Figure 12: Palo Alto Networks Public Float (SCA iPortal)
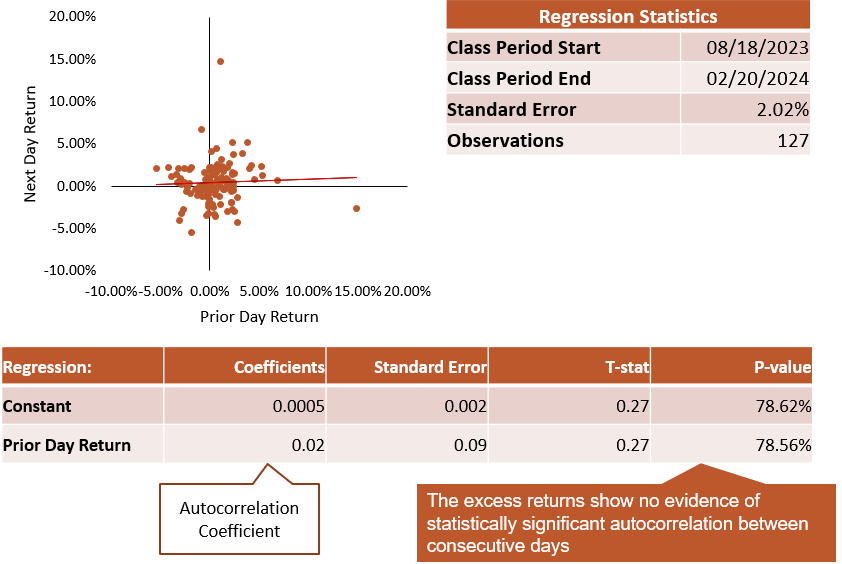
Autocorrelation
Purpose: Autocorrelation is a term used to describe predictability of future returns by current returns. The presence of autocorrelation, also known as serial correlation, is inconsistent with market efficiency because it implies that not all value-relevant information is quickly incorporated into the security price. Therefore, autocorrelation tests have been a staple of market efficiency testing since the introduction of the Efficient Markets Hypothesis in 1970.[15] Courts have also relied on autocorrelation results in establishing market efficiency.[16]
Result: Based on the results obtained though SCA iPortal, there is no evidence of autocorrelation in either the PANW daily raw or excess returns. See Figure 13. According to the benchmark in Bhole, Surana, and Torchio (2020), about 27% of US listed stocks had a statistically significant autocorrelation (an indicator against market efficiency), putting PANW in the same bucket as the 73% which did not.
Figure 13: Autocorrelation Regression (SCA iPortal)
Loss Causation / Price Impact
Event Study
The event study is a typical starting point of any analysis of loss causation or price impact. The event study on the alleged disclosure date shows that the date has statistically significant price decline of 28.2% when adjusted for market and industry factors. See Figure 14.
Figure 14: Disclosure Dates Event Study (SCA iPortal)
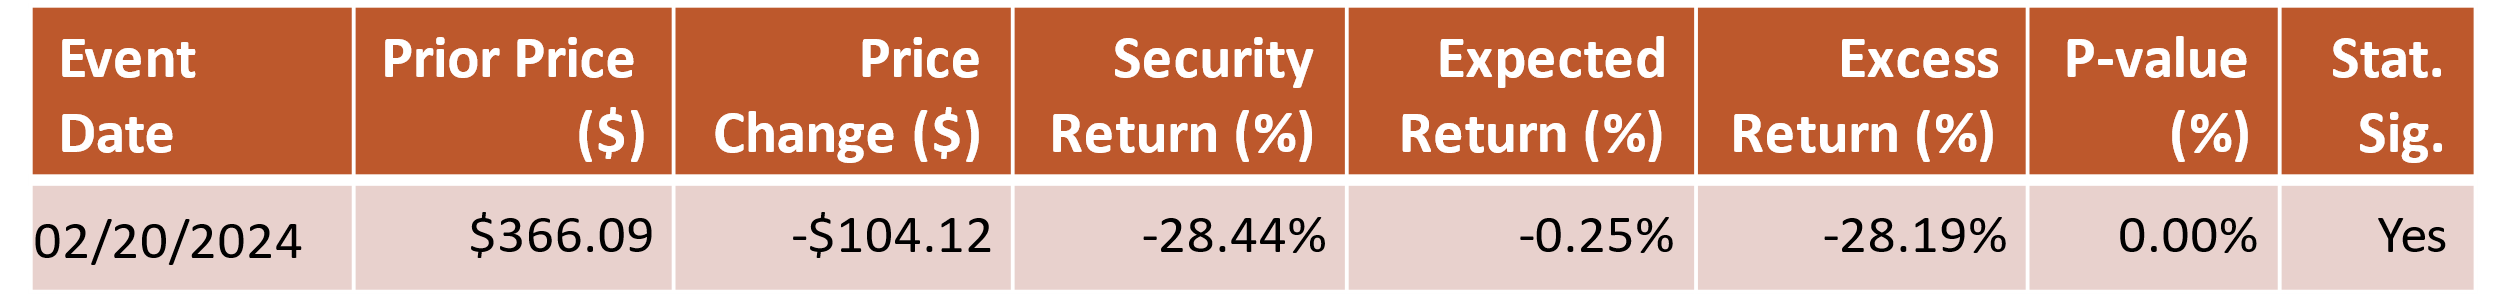
The strength of the event study results (e.g. almost zero p-values) also suggests that that the statistical significance of the disclosure date will be hard, if not impossible, to defeat by defense experts by using conventional event study tools. Additional loss causation research results are shown below.
Intraday Data and News Flow
Intraday Data and News Flow on February 21, 2024
Figure 15: Intraday Price on February 21, 2024 (SCA iPortal)
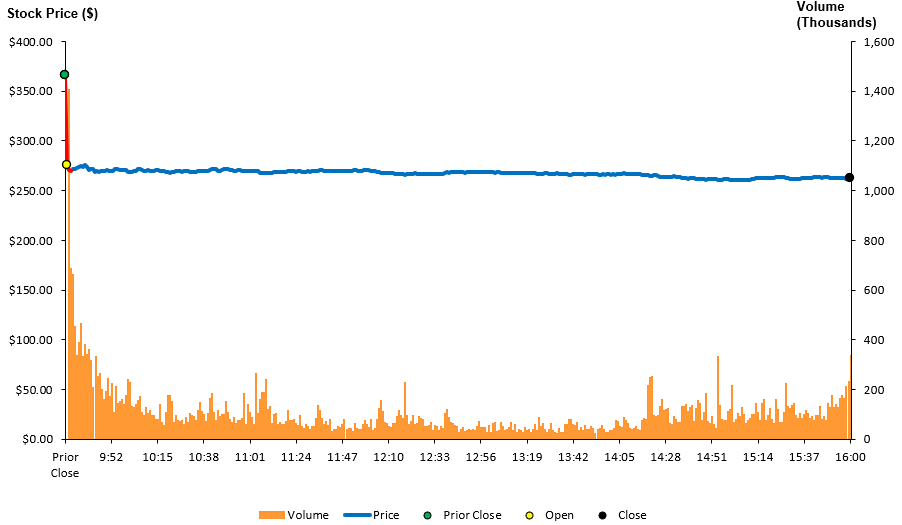
On February 20, 2024 (after market close), PANW released its 2Q 2024 earnings announcement. There were no other announcements after the close on that date.
The immediacy of the price reaction on the morning of February 21, 2024, confirms that the stock price decline on February 21, 2024, is more than likely due to the release of the earnings. See Figure 15. A review of the news headlines surrounding the decline of the stock price on February 21, 2024, also confirms that the market was responding to the earnings announcement.
Additional Discussion
Based on the facts of the case above, it appears that important loss causation arguments will likely center on the timeliness of the disclosure:
- Whether the slowdown reflected in the Q3 2024 guidance was known to PANW sufficiently early before the quarterly announcement on February 20, 2024, and
- What operating or financial information was PANW obligated to disclose and at what time before the quarter end.
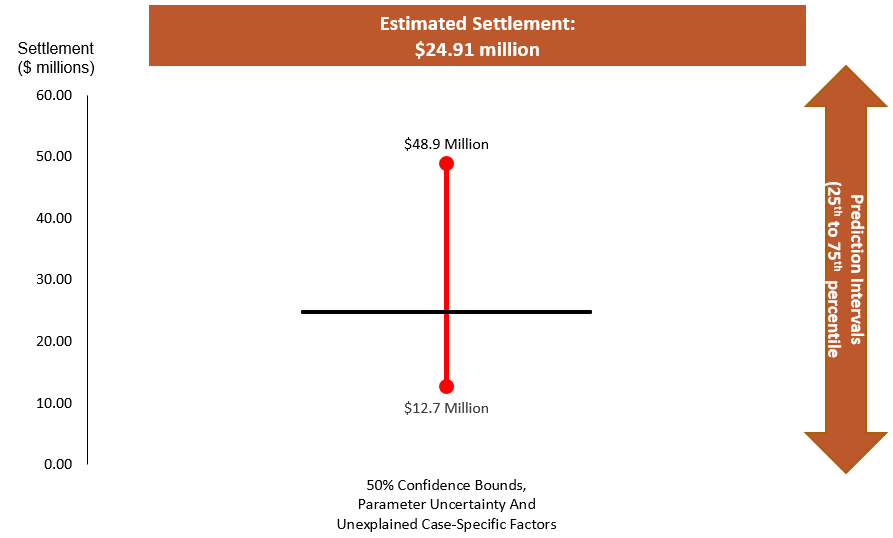
Settlement Analysis
The expected settlement in the Palo Alto Networks Securities Litigation, at the outset of the case, is approximately $24.9 million. See Figure 16. This represents a little less than 1% of the likely aggregate damage claim of approximately $3.0 billion. This estimate is consistent with historical trends in which “very large” cases (with damage claims in excess of $1 billion) settle for less than 2% of the damage estimate.[17]
The prediction interval from the 25th to 75th percentiles (50% confidence) ranges from $12.7 million to $48.9 million. The prediction interval is computed via an econometric model calibrated on similar settled cases filed since 2005. The prediction interval takes into account both the uncertainty of the calibrated model parameters and the existence of unpredictable factors in the settlement of every case.
Figure 16: Settlement Prediction Interval (SCA iPortal)
Appendix: Damages Assumptions
- The Plaintiff-style damages are the product of Damages Per Share and Damaged Shares
- Price Inflation is computed using the sum of the disclosure-days’ excess dollar returns.
- Damages per share computed using a constant dollar inflation. Constant dollar inflation is a constant dollar amount between the disclosure dates.
- Excess dollar returns (i.e. price changes adjusted for market and industry effects) are computed based on a market model regression using S&P 500 Index (market index) and the S&P 500 Systems Software (Sub Ind) (industry index).
- Damaged shares are computed via multi-trader model:
- The model counts the number of damaged shares, subject to assumptions, from institutional holdings data.
- The model applied a 2-trader trading model for the non-institutional holdings.
Footnotes
SHAREHOLDER ALERT: Recent Purchasers of Palo Alto Networks Who Have Lost Money May Be Able To Recover Damages – Block & Leviton Is Investigating – GlobeNewswire, 21 Feb 2024. ↑
“In any private action arising under this chapter in which the plaintiff seeks to establish damages by reference to the market price of a security, if the plaintiff sells or repurchases the subject security prior to the expiration of the 90-day period described in paragraph (1), the plaintiff’s damages shall not exceed the difference between the purchase or sale price paid or received, as appropriate, by the plaintiff for the security and the mean trading price of the security during the period beginning immediately after dissemination of information correcting the misstatement or omission and ending on the date on which the plaintiff sells or repurchases the security.” 15 U.S. Code § 78u–4 – Private securities litigation ↑
A similar effect is discussed also by J. Schreiber and J. Tschirgi (2020), “Market Rebound May Curb Securities Class Actions, Damages”, Law360, July 31, 2020. ↑
Bharat Bhole, Sunita Surana. & Frank Torchio (2020), “Benchmarking Market Efficiency,” 2020 U. Ill. L. Rev. Online 96. While the paper uses data up to 2018, the 3-year measurement periods provide some credibility to the benchmark values. ↑
Cammer v. Bloom, 711 F. Supp. 1264 (D.N.J. 1989). ↑
Cammer v. Bloom, 711 F. Supp. 1264 (D.N.J. 1989). ↑
Barber, Brad M., Paul A. Griffin, and Baruch Lev. “The fraud-on-the-market theory and the indicators of common stocks’ efficiency.” J. Corp. L. 19 (1993): 285. ↑
Cammer v. Bloom, 711 F. Supp. 1264 (D.N.J. 1989). ↑
Cammer v. Bloom, 711 F. Supp. 1264 (D.N.J. 1989). ↑
Cammer v. Bloom, 711 F. Supp. 1264 (D.N.J. 1989). ↑
For review of studies on the topic, see Jonathan M. Karpoff, The Relation Between Price Changes and Trading Volume: A Survey, 22(1) J. FIN. & QUANTITATIVE ANALYSIS 109, 121 (1987). See also Chen, Gong-Meng, Michael Firth, and Oliver M. Rui. 2001. The dynamic relation between stock returns, trading volume, and volatility. Financial Review 36: 153–74. ↑
Krogman v. Sterritt, 202 F.R.D. 467, 474 (N.D. Tex. 2001). ↑
Krogman v. Sterritt, 202 F.R.D. 467, 474 (N.D. Tex. 2001). ↑
Krogman v. Sterritt, 202 F.R.D. 467, 474 (N.D. Tex. 2001). ↑
Fama, Eugene F. “Efficient capital markets.” Journal of finance 25.2 (1970): 383-417. ↑
In re PolyMedica Corp. Sec. Litig., 453 F. Supp. 2d 260, 276-78 (D. Mass. 2006)) ↑
See Cornerstone Research, “Securities Class Action Settlements: 2023 Review and Analysis”. See also NERA, “Recent Trends in Securities Class Action Litigation: 2023 Full-Year Review.” ↑