An initial economic assessment of the BioVie Securities Litigation
Introduction
This post contains an early case assessment of the Biovie Securities Case (3:24-cv-00035). The article discusses the potential damages in the case, the market efficiency indicators for the company, various loss causation issues, and potential settlement ranges.
This article is part of a series of standardized preliminary economic analyses of recently filed cases. In separate publication I described the potential benefits from standardizing some preliminary case assessments. The opinions expressed are those of the author only and do not necessarily reflect the views of their company, employer, or its clients. This article is for general information purposes and is not intended to be and should not be taken as legal advice. All tables and charts sourced from SCA iPortal are published with permission.
Summary of the BioVie Case
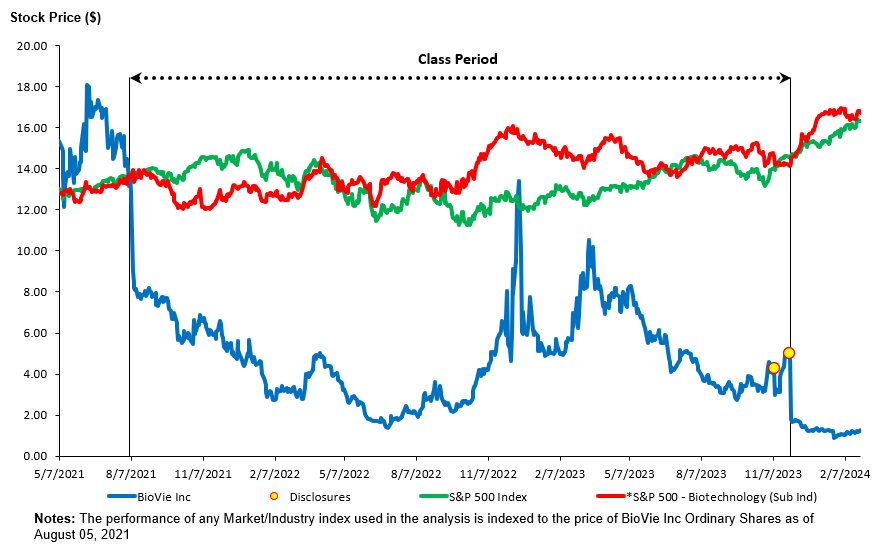
BioVie (“BIVI”) is a biotechnology firm which conducted Phase 3 clinical trial of NE3107 for Alzheimer’s Disease between 2021 and 2023. See Figure 1. Plaintiff’s arguments center around the fact that, due to COVID 19 restrictions, many trial participants did not have access to the trial sites. Under the circumstances a large number of trial sites conducting BIVI’s clinical trial allegedly engaged in scientific misconduct in handling those cases. The complaint alleges 2 disclosure events shortly before the expected results of the trial were to be announced. First, on November 8, 2023, the Company filed its quarterly report Form 10-Q for the quarter ending September 30, 2023. In this 10-Q, the company noted, among other things, that they “uncovered what appears to be potential scientific misconduct and significant non-compliance with GCPs and regulation at six sites.” Then, on November 29, 2023, BIVI filed a Form 8-K which disclosed that the “Phase 3 clinical trial ‘did not achieve statistical significance because we had to exclude so many patients from the trials that we believe engaged in improper practices.’ [Defendant Do] further noted that BioVie had to exclude 358 patients, which represented ‘over 80% of our enrolled populations due to suspected improper conduct at 15 clinical sites.’”
The class period is from August 5, 2021, to November 29, 2023.
Figure 1: BioVie class period (SCA iPortal)
Damages
Figure 2: Plaintiff-Style Aggregate Damages (SCA iPortal)

The plaintiff style aggregate damages are computed subject to a number of assumptions. See the Appendix: Damages Assumptions below.
Damages Discussion
Damages Estimates
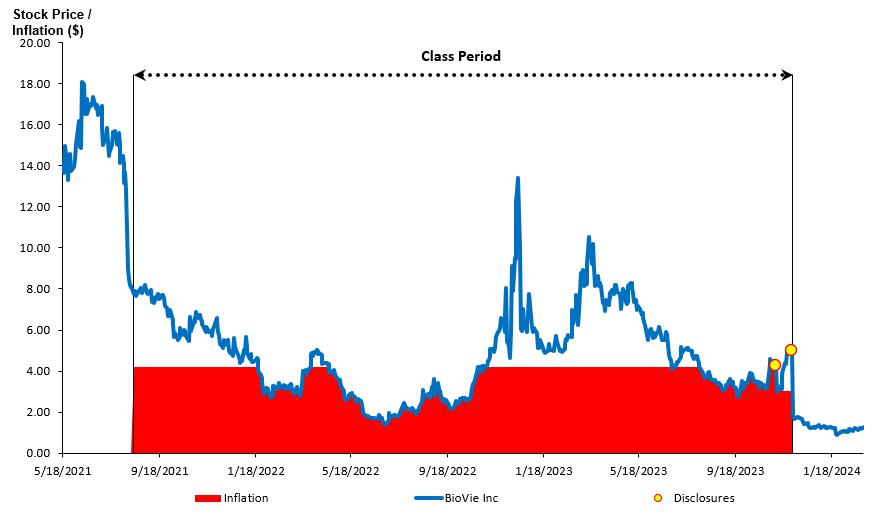
The aggregate damages “Without 90-day Lookback Cap” are roughly equal to the product of 13.2 million BIVI public float shares and the $4.20 “peak inflation” which is computed as the combined excess price decline on the two disclosure dates. See Figure 4.
The aggregate damages “With 90-day Lookback Cap” applies an upper limit to the $4.20 damage per share as stipulated in the PSLRA. [1] The upper limit is the difference between the purchase price and the average price for up to 90 days after the end of the class period.
An observant reader may notice that the application of 90-day lookback provision reduces damages despite no observable rebound in the stock price after the class period. The reason is that even without price rebound, the 90-day lookback provision can limit the damages on shares retained at, or sold after, the end of the class period when the price difference between purchase price and 90-day average price is smaller than the purchase inflation. This possibility has been discussed elsewhere as well.[2] As I discuss below, for many investors in the BIVI case, the 90-day lookback cap on damages is smaller than the “peak inflation” during the class period.
Treatment of the shares held by Acuitas Group Holdings
The current analysis assumes that holdings of Acuitas Group Holdings LLC are NOT damaged.
The number of BIVI shares outstanding reached 37 million during the class period. However, between 19.8 and 23.8 million shares were owned by insiders/ strategic entities, leaving only between 2.2 million and 13.2 million shares that could be damaged at various times in the class period.
Figure 3: Insider and Strategic Investor Shares (SCA iPortal)
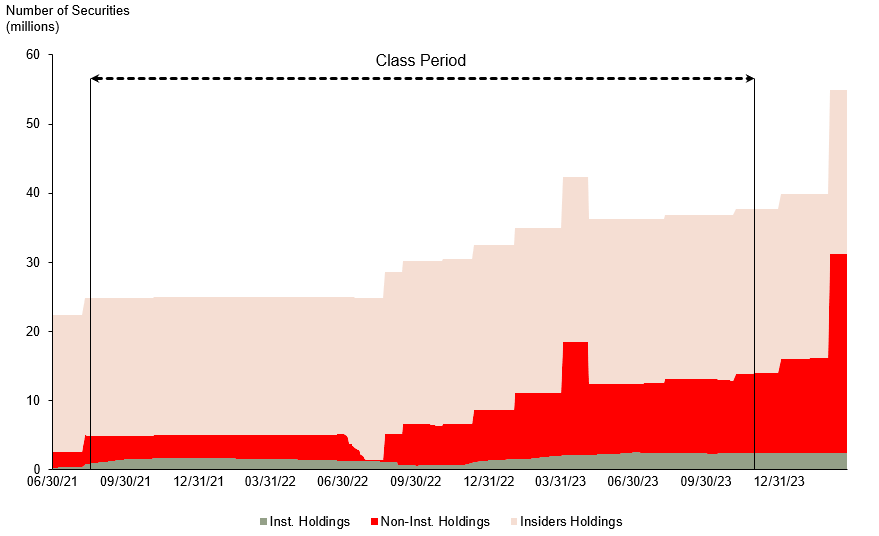
Considering the large insider holdings in BIVI stock, I check the latest form DEF-14A for the beneficial ownership structure by insiders and strategic investors. It shows that Acuitas Group Holdings owns 69% of BIVI stock. The footnote to the holdings of Acuitas Group states “All shares held of record by Acuitas Group Holdings, LLC, a limited liability company 100% owned by Terren Peizer, and as which Mr. Peizer may be deemed to beneficially own or control. Mr. Peizer disclaims beneficial of any such securities.” Mr. Peizer is the former CEO of BIVI (2018-2023).
As part of the initial assessment, it is deemed that any company controlling as much as 69% of the shares would not be eligible for damages itself. It is not known whether this question will become an issue during the legal proceedings, but the number of shares is large enough to cause a significant change in the aggregate damages estimate.
Disclosure dates excess declines may overstate inflation (“Excess Disclosure” problem)
There is uncertainty related to the level of price inflation in BIVI stock. The uncertainty stems from the following two facts which I label “Excess Disclosure” problem.
- The “constant dollar” (see Appendix for definition) inflation sums the “Excess Return ($)” on the two disclosure dates. That total, $4.20 in this case, is typically used as a “peak inflation” under the constant dollar inflation assumption. See Figure 4.
- The stock price, however, was well below $4.20 for a long stretch of the class period. See Figure 1.
The conclusion from the two facts above is that inflation cannot be $4.20 when the stock price is as low as $1.38. It makes no economic sense.
Figure 4; Stock price inflation Inputs (SCA iPortal)

Current “Plaintiff-Style Analysis” treatment of the “Excess Disclosure” problem
The current Plaintiff-style analysis gives maximal benefit to the plaintiff claims and assumes that stock price peak inflation is the full $4.20 unless the stock price declines below that level. Whenever the stock price is below the peak inflation the inflation is set equal to the stock price. In other words, to the plaintiff’s benefit, the analysis assumes that at a price of $6.00 the inflation is $4.20 but at a price of $1.38 the inflation is $1.38. See Figure 5. This issue is likely to be an important decision for the damage experts. A few simple alternatives are considered here.
Figure 5: Plaintiff-Style price inflation (Base Case) (SCA iPortal)
Alternative “Plaintiff-Style Analysis” treatments of the “Excess Disclosure” problem
Constant Percent Inflation Assumption
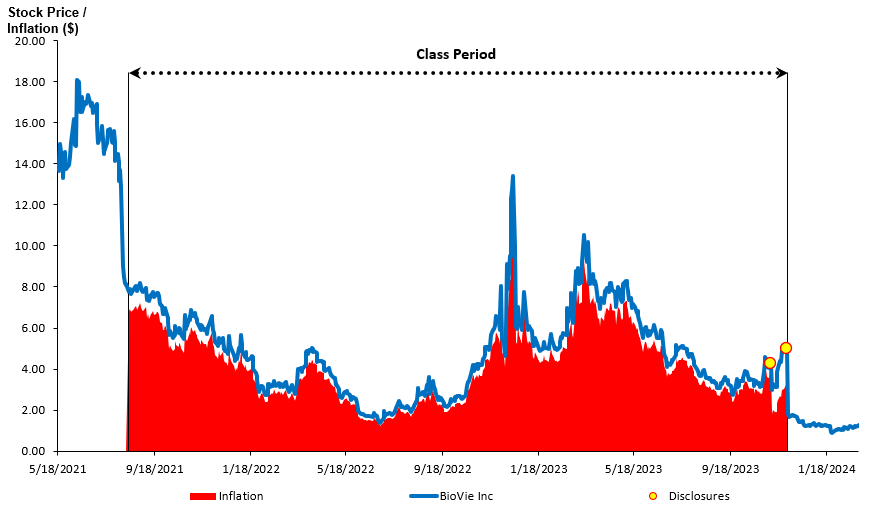
One alternative possibility is for the usual “constant dollar” assumption to be replaced by a “constant percent” assumption (see Appendix for definition). See Figure 6. Note, however, that the “constant percent” assumption may not be economically justifiable in describing the effect of a single drug and the assumption has been criticized for being inconsistent with Dura. Under a constant percent assumption, the stock price inflation is a hefty 88% of the actual price prior to November 9, 2023. And since the price of BIVI went as high as $13.38 during the class period, damages under a constant percent inflation assumption go up to $66.29 million.
Figure 6: Constant Percent Inflation in Plaintiff-Style Damages (SCA iPortal)
Limited Constant Dollar Inflation Assumptions
Other alternatives, more favorable to defendants, may be based on an argument that IF the “constant dollar” inflation assumption is appropriate, by definition, the peak inflation cannot exceed the lowest stock price during the class period before the first disclosure date, i.e., $1.38. See Figure 7. Setting the constant dollar inflation at $1.38 results in significant reduction in Aggregate Plaintiff Style Damages to about $18.9 million, with little difference whether the 90-day Lookback Cap is applied or not.
Figure 7: Limited Constant Dollar Inflation in Plaintiff-Style Damages (SCA iPortal)
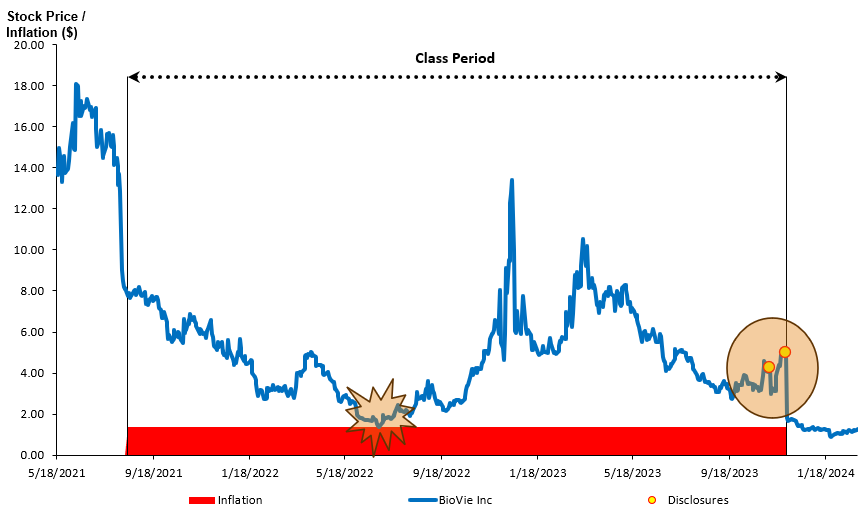
Of course, to argue that peak inflation is only $1.38, or any other number not derived from the disclosure-date declines, defense experts need to explain what caused the combined $4.20 decline on November 9 and 29, 2023. This is a non-trivial challenge, particularly on a date like November 29, 2023 when no material confounding news are released (see Loss Causation section).
A complete review of this question is well beyond the scope of an initial economic analysis, but experts could focus on the “bouncing” pattern of the stock price around the two disclosure dates. See Figure 7. The stock price increased substantially from $3.17 on October 27, 2023, to $4.26 on November 8, 2023, and then declined to $3.01 following the disclosure on November 9, 2023. Following November 9, 2023, the stock price recovered to $5.24 (even above the November 8, 2023, level) and then collapsed to $1.96 on November 29, 2023.
A “bouncing” pattern in the stock price is not remarkable on its own. The constant dollar inflation assumption treats it as a fluctuation of the “true” value in the stock price. However, given that the pattern results in “peak inflation” which exceeds the stock price, it is possible that some part of the disclosure-day declines (the down-movements of the bounce) is a reversal of the short-term gains (the up-movements of the bounce). Of course, a systematic review of facts, trading data and analyst reports is needed to confirm such a hypothesis.
Non-traditional Inflation Assumptions
Lastly, it is possible that the price inflation exhibits some other pattern, different from constant dollar and constant percent, which is consistent with the observed BIVI price. For example, “rising inflation” assumptions have been used especially in cases in which allegations include realization of undisclosed or insufficiently disclosed risk. While there is no indication that the plaintiff is arguing that BIVI has specifically failed to disclose COVID-related risk to the drug trial, a rising inflation pattern could be considered by experts in the case.
Class Certification – Market Efficiency
Defendants usually face an uphill battle in fighting market efficiency on US exchange listed securities. BIVI is not an exception to that rule but, as I show below, it does present some opportunities for defense experts. In the discussion below, I cite the test and the corresponding numeric values, and compare those value to benchmarks provided in a paper by Bhole, Surana and Torchio (2020).[3]
Note that the authors of the paper propose, without supporting analysis, that a factor which is above the 10th percentile for all stocks in the direction required for efficiency should be considered to be indicative of efficiency. For example, if the Cammer turnover statistic for BIVI is higher than the turnover of 10% of the US-listed securities, then Bhole, Surana and Torchio (2020) argue that it should be considered supportive of market efficiency.
Cammer Factors:
Cammer 1: Weekly Volume Turnover
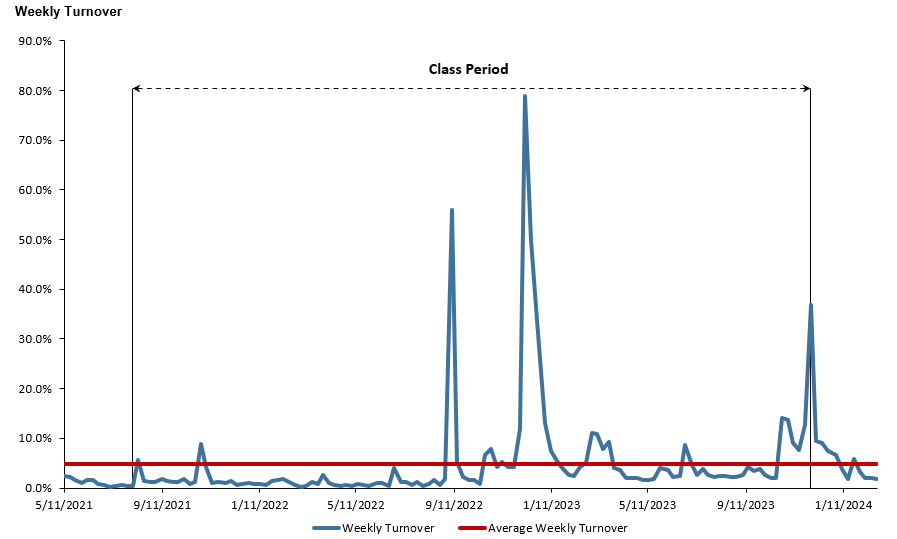
Purpose: According to Cammer v Bloom “[t]he reason the existence of an actively traded market, as evidenced by a large weekly volume of stock trades, suggests there is an efficient market is because it implies significant investor interest in the company.” The decision states that “turnover measured by average weekly trading of 2% or more of the outstanding shares would justify a strong presumption that the market for the security is an efficient one; 1% would justify a substantial presumption.”[4]
Result: The average ratio of weekly trading volume to securities outstanding over the class period is 4.92. This is well over the 95th percentile among US listed stocks. This estimate justifies “a strong presumption that the market for the security is an efficient one,” according to Cammer.
Figure 8: Weekly Trading Volume (SCA iPortal)
Cammer 2: Number of Analysts Following the Stock
Purpose: According to Cammer v Bloom, “it would be persuasive to allege a significant number of securities analysts followed and reported on a company’s stock during the class period. The existence of such analysts would imply, for example, the [company’s] reports were closely reviewed by investment professionals, who would in turn make buy/sell recommendations to client investors.”[5]
Result: Average number of analysts covering the company over the class period is 2.7. This is above the 10th percentile but below the 25th percentile of US listed firms.
Figure 9: Number of Securities Analysts (SCA iPortal)

Cammer 3: Number of Market Makers
Purpose: According to Cammer v Bloom, “[t]he existence of market makers and arbitrageurs *1287 would ensure completion of the market mechanism; these individuals would react swiftly to company news and reported financial results by buying or selling stock and driving it to a changed price level.”
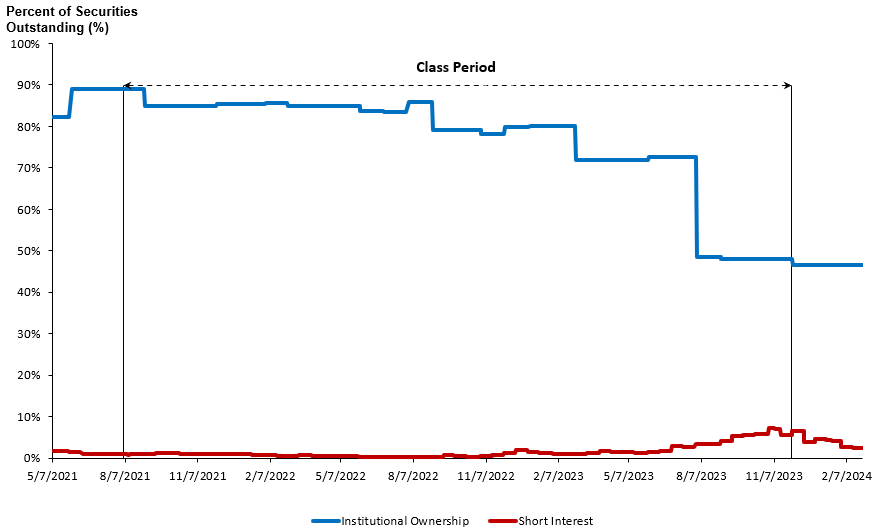
However, the “Market makers count” was criticized for its misleading nature as early as 5 years after the Cammer decision. Barber, Griffin and Lev (1993) concluded that “apparently, market makers just “make a market” in the stock, namely match buy and sell orders, without contributing to the information available about the stock.”[6] The definition of a “market maker” also differs across market structures, e.g., NYSE vs NASDAQ. As a result, economic experts have used ‘proxies’ for what the Cammer decision envisioned are “individuals would react swiftly to company news and reported financial results by buying or selling stock and driving it to a changed price level.”[7] The most common such ‘proxies’ are the percentage of institutional investors holding a security and the short interest as a fraction of the shares outstanding.
Result 1: The average percentage of BIVI stock held by institutional investors during the class period was 76.3%. This is above the 50th percentile of US listed securities.
Result 2: The average short interest of BIVI stock as fraction of securities outstanding during the class period was 1.57%. This is above the 25th percentile of US listed stocks.
Figure 10: Sophisticated Investors (SCA iPortal)
Cammer 4: Eligibility to file SEC Form S-3
Purpose: According to Cammer v Bloom, “it would be helpful to allege the Company was entitled to file an S-3 Registration Statement in connection with public offerings or, if ineligible, such ineligibility was only because of timing factors rather than because the minimum stock requirements set forth in the instructions to Form S-3 were not met.” [8]
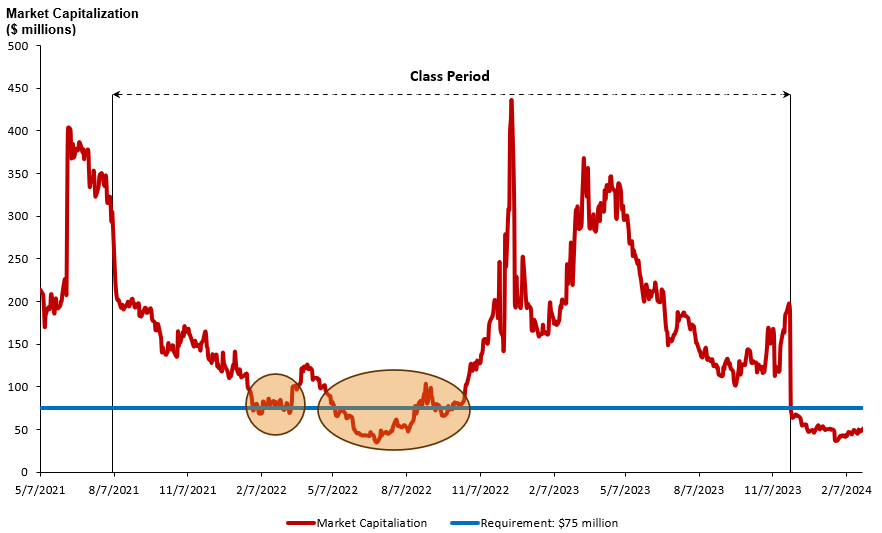
Result: BIVI actually filed a form S-3 on January 1, 2021 (before the class period) and August 18, 2023 (during the class period). Also, BIVI’s market capitalization was above the minimum required ($75 million) for filing form S-3 for over 85% of class period. While periods with market capitalization under $75 million do exist, the evidence is overall supportive that BIVI was eligible to file Form S-3.
Figure 11: Periods when BioVie’s Market Capitalization was below $75 million (SCA iPortal)
Cammer 5: Cause-and-Effect Relationship Between Material News and Stock Returns
Purpose: The Cause-and-Effect (aka Fifth Cammer) Factor is considered, by most experts and courts, the most direct test of market efficiency. Cammer v Bloom states “it would be helpful to a plaintiff seeking to allege an efficient market to allege empirical facts showing a cause-and-effect relationship between unexpected corporate events or financial releases and an immediate response in the stock price. This, after all, is the essence of an efficient market and the foundation for the fraud on the market theory.”[9]
There are a number of tests that can be applied to this factor. Two standardized tests are presented below:
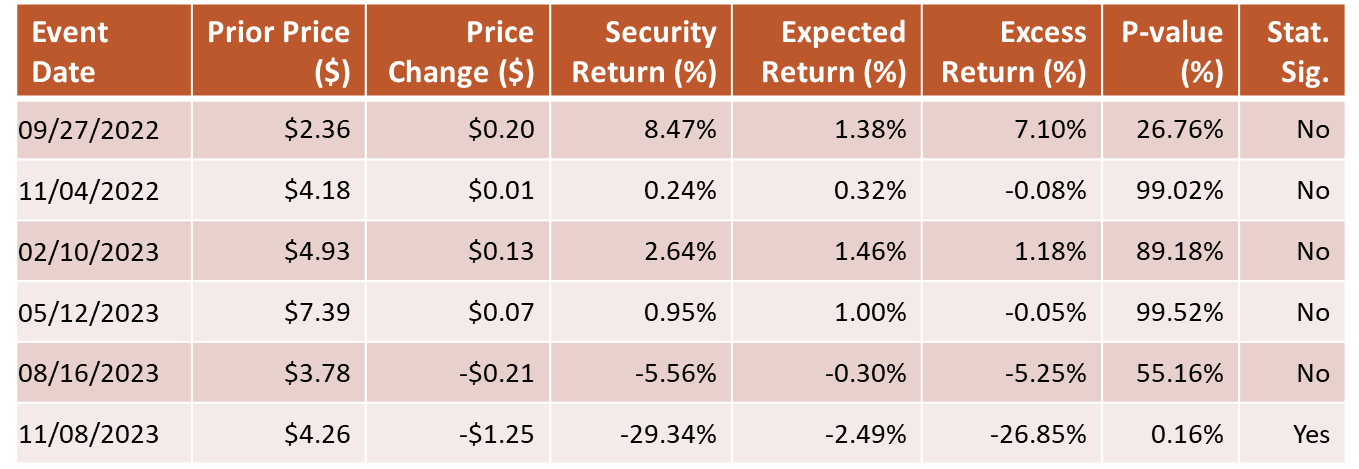
Result 1: Percent of earnings announcements with statistically significant price reaction during the class period: 16.7% (1 out of 6). See Figure 12.
This is a result of an event study on the days of earnings releases by BIVI during the class period. Earnings days are the most commonly used dates with potentially material new information. It should be noted, however, that the use of earnings announcements needs to be reviewed further by economic experts to determine whether the lack of statistically significant reaction to any of them is scientifically expected or surprising. Analysis needs to be conducted to determine if the earnings announcements were in line with expectations, contained earnings surprises or material new information such future guidance. This analysis will involve expert judgment.
Figure 12: Earnings Dates Event Study (SCA iPortal)
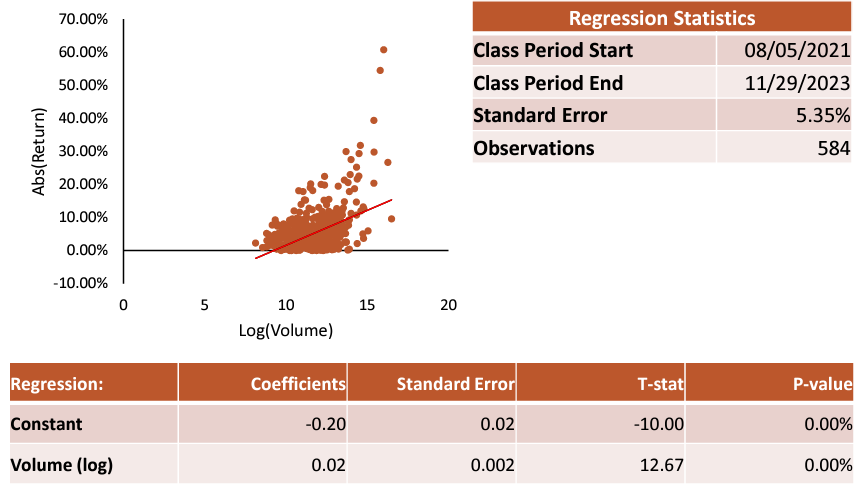
Result 2: The correlation between volume and security returns IS statistically significant. See Figure 13.
This test assumes that volume is a proxy for news flow.[10] Thus, a test of the correlation between returns and volume is arguably a test of the cause-and-effect between information flow and returns. According to Bhole, Surana and Torchio (2020), over 98% of US listed stocks exhibit statistically significant correlation between daily returns and volumes.
Figure 13: Return – Volume Regression (SCA iPortal)
Krogman Factors
Krogman 1: Market Capitalization
Purpose: According to Krogman v. Sterritt, “[m]arket capitalization, calculated as the number of shares multiplied by the prevailing share price, may be an indicator of market efficiency because there is a greater incentive for stock purchasers to invest in more highly capitalized corporations.”[11]
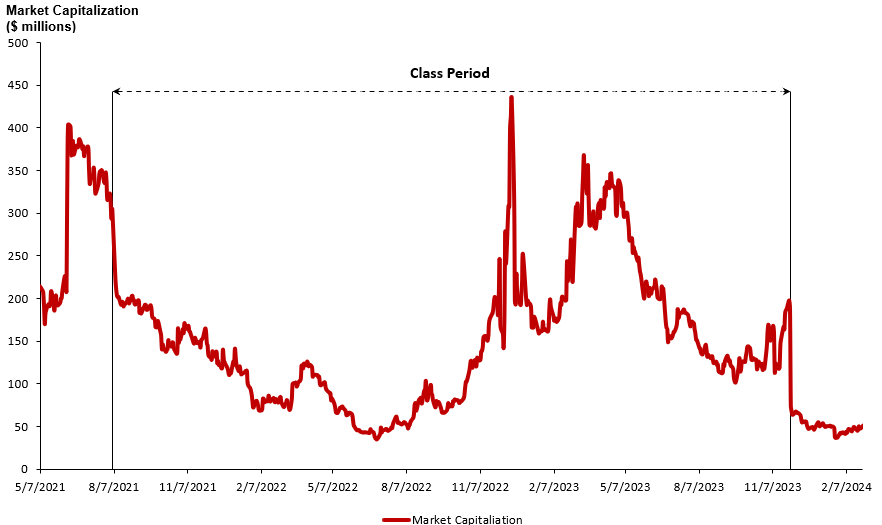
Results: The average market capitalization of BIVI stock during the class period was $150 million, though it varied between $34 million and $442 million. The $150 million average is above the 10th percentile but below the 25th percentile of US listed stocks. See Figure 14.
Figure 14: BioVie Market Capitalization (SCA iPortal)
Krogman 2: Bid-ask Spread
Purpose: According to Krogman v Sterritt, “A large bid-ask spread is indicative of an inefficient market, because it suggests that the stock is too expensive to trade.”[12]
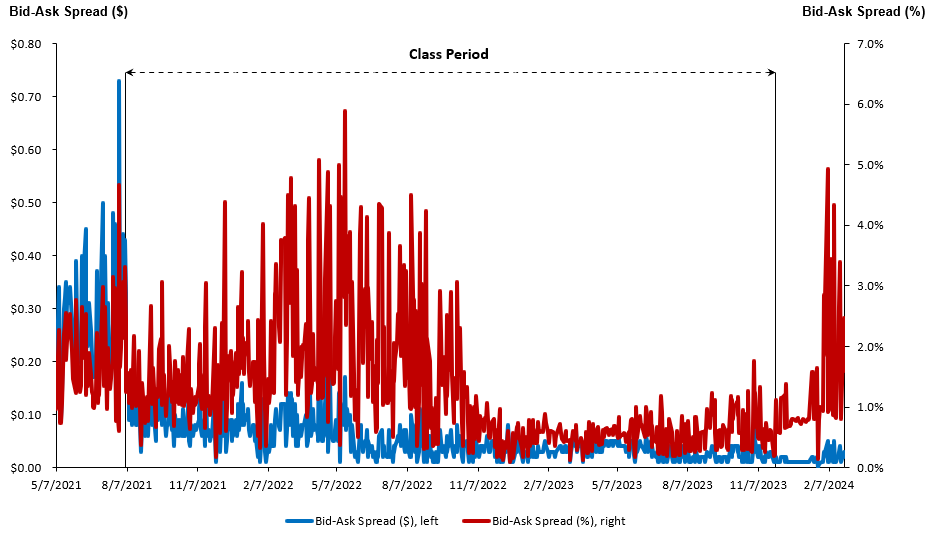
Results: The average Bid-Ask Spread of a BIVI Inc Ordinary Share was, on average, $0.05, or 1.23% of the security price. See Figure 15. An average bid-ask spread of 1.23% is higher than the 75th percentile but below the 90th percentile of bid-ask spreads of US listed companies. (Note: For Bid-Ask spreads LOWER is better)
Figure 15: BioVie Bid-Ask Spread (SCA iPortal)
Krogman 3: Public float
Purpose: According to Krogman v Sterritt, “Because insiders may have private information that is not yet reflected in stock prices, the prices of stocks that have greater holdings by insiders are less likely to accurately reflect all available information about the security.”[13]
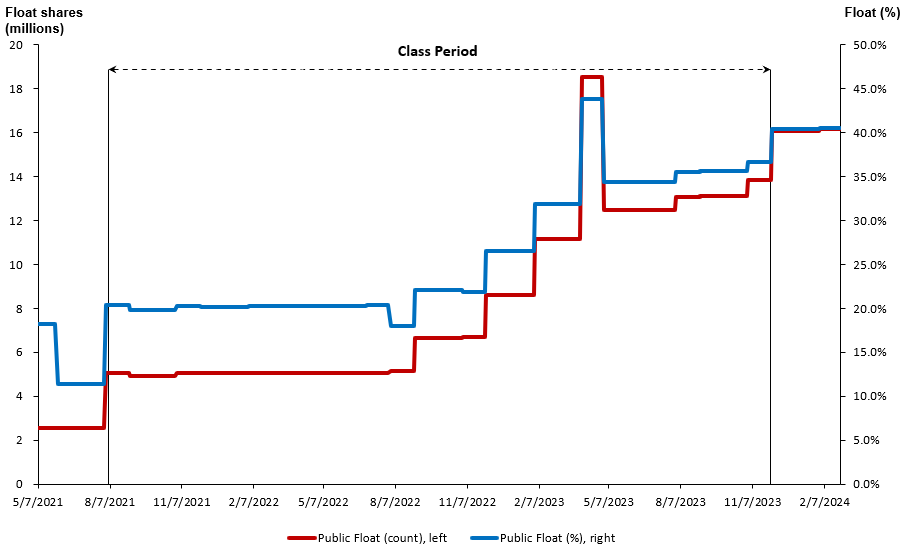
Result: The average Public Float of BIVI Inc Ordinary Shares was, on average, 8.3 million, or 26.2% of the outstanding securities. The percentage of public float, however, increased gradually from about 20% at the start to about 36% at the end of the class period.[14] See Figure 16. There is no benchmark for public float shares of outstanding stock of which I am aware.
Figure 16: BioVie Public Float (SCA iPortal)
Autocorrelation
Purpose: Autocorrelation is a term used to describe predictability of future returns by current returns. The presence of autocorrelation, also known as serial correlation, is inconsistent with market efficiency because it implies that not all value-relevant information is quickly incorporated into the security price. Therefore, autocorrelation tests have been a staple of market efficiency testing since the introduction of the Efficient Markets Hypothesis in 1974.[15] Courts have also relied on autocorrelation results in establishing market efficiency.[16]
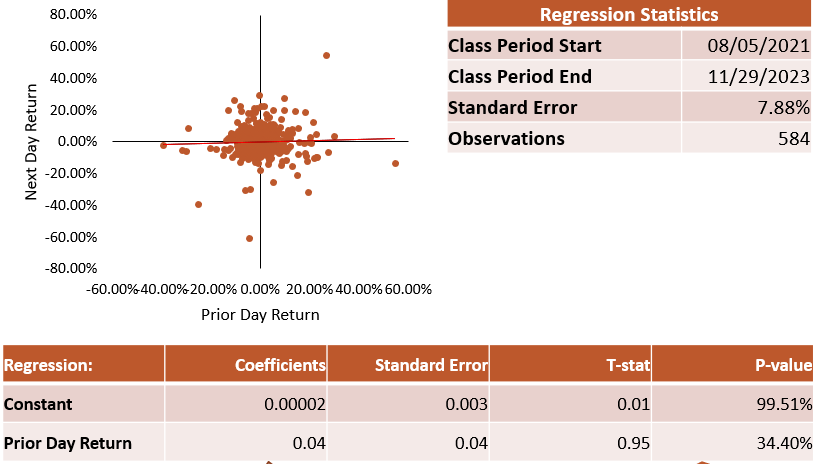
Result: There is no evidence of autocorrelation, i.e., predictability, in either the BIVI daily raw or excess returns. See Figure 17. According to the benchmark in Bhole, Surana, and Torchio (2020), about 27% of US listed stocks had a statistically significant autocorrelation, putting BIVI in the same bucket as the 73% which did not.
Figure 17: Autocorrelation Regression (SCA iPortal)
Loss Causation / Price Impact
Event Study
The event study is a typical starting point of any analysis of loss causation or price impact. The event study on the alleged disclosure dates shows that both dates have statistically significant price declines, even when adjusted for market and industry factors. See Figure 18. This is not surprising, given that the raw returns are -29% and -60%, and the excess returns are -27% and -61%, respectively. These returns are more than three times and seven times, respectively, larger than the typical day-to-day variation of BIVI stock price.
Figure 18: Disclosure Dates Event Study (SCA iPortal)

The strength of the event study results (e.g., almost zero p-values) also suggests that the statistical significance of the disclosure dates will be hard to defeat by defense experts using traditional event study methods. Given the high volatility of the BIVI returns, an alternative methodology for statistical testing could use forward looking volatility measures, inferred from options prices, instead of the historical ones used by the event study.[17] Such methods are far less tested in court proceedings than the standard methodology used in the reported results.
Intraday Data and News Flow
Intraday Data and News Flow on November 9, 2023
Figure 19: Intraday Price on November 9, 2023 (SCA iPortal)
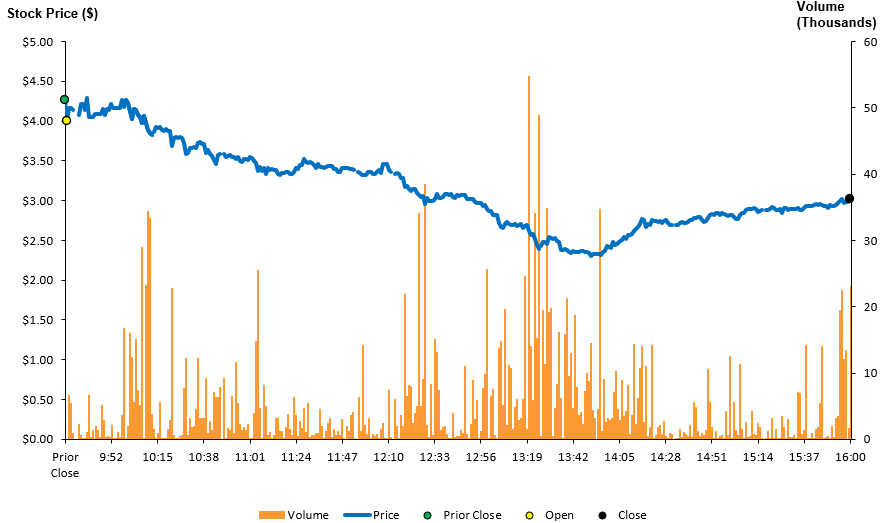
On November 8, 2023, BIVI filed a 10-Q and announced earnings results. Overall, while the daily decline on November 9, 2023, is statistically significant, there seem to be a number of questions that need to be researched to confirm the Loss Causation inference from that announcement.
- One indicative fact is that no news headline available to me at this stage contains reference to the alleged disclosure. While this observation needs to be confirmed with a more exhaustive search of news on the day, it does suggest that the disclosure was not “widely” discussed.
- From the daily price chart (See Figure 1), one can observe that the price decline on November 9, 2023, is a reversal of a steep gain in the stock price during the previous 10 days.
- Related to the prior point, it appears that the intraday decline of the BIVI stock price (see Figure 19) happened gradually with volume spiking at midday. The lack of substantial decline or significant volume at the market open (following the disclosure on the prior day) is an interesting fact, especially when combined with the absence of much news coverage of the disclosure statements.
Intraday Data and News Flow on November 29, 2023
Overall, the loss causation inference from the November 29, 2023, disclosure seems to be stronger than that from November 8, 2023.
Before the market opened on November 29, 2023, BIVI released an 8-K announcing that the “Phase 3 clinical trial ‘did not achieve statistical significance because we had to exclude so many patients from the trials that we believe engaged in improper practices.’ He further noted that BioVie had to exclude 358 patients, which represented ‘over 80% of our enrolled populations due to suspected improper conduct at 15 clinical sites.’”
Figure 20: Intraday Price on November 29, 2023 (SCA iPortal)
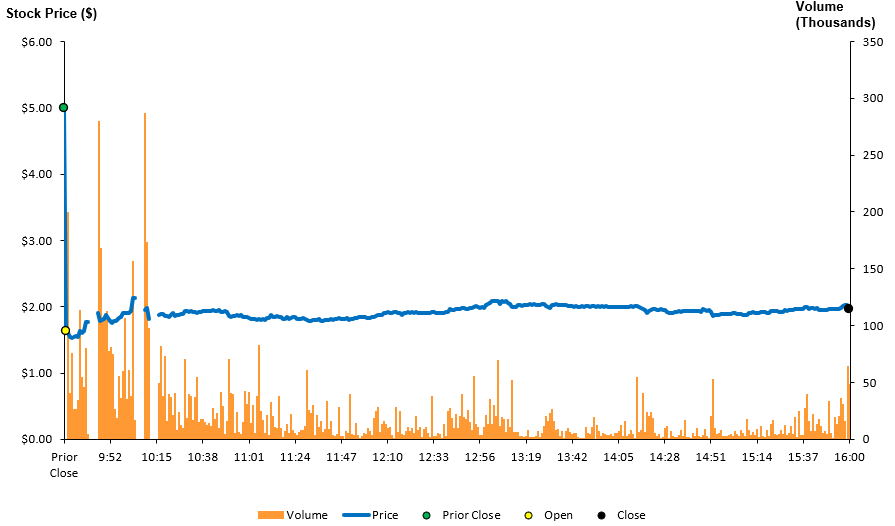
- The decline on November 29, 2023, was over 61% (adjusted for market and industry factors)
- The intraday data clearly shows the decline at the opening of the market. See Figure 20. Unlike the November 8, 2023 (after market close), announcement, virtually the whole daily decline on November 29, 2023, occurred in the first several minutes of trading.
- A review of the news headlines on the day shows that the disclosure news was heavily covered. In fact, almost no other news was covered regarding BIVI on that day.
Additional Discussion
In addition to the topics outlined above in discussing the Event Study, Intraday prices and news flow, one additional topic appears to be central to the Loss Causation analysis. As BIVI noted in its statements, and the complaint acknowledges, the clinical trial was conducted by a third party on behalf of BIVI. In such a case, it is important for the experts and counsel to clarify BIVI’s duty to disclose and timeliness of its disclosure. Important questions are “what did BIVI know and when” and “at what stage was BIVI required to disclose any results.”
Settlement Analysis
Figure 21: Settlement Prediction Interval (SCA iPortal)

The expected settlement in the BioVie Securities Litigation, at the outset of the case, is approximately $3.98 million. See Figure 21. This is approximately 8% of the roughly $50 million in estimated damages and consistent with historical experience.[18]
The prediction interval from the 25th to 75th percentiles (50% confidence) ranges from $2.0 to $7.7 million. The prediction interval is computed via an econometric model calibrated on similar settled cases filed since 2005. The prediction interval takes into account both the uncertainty of the calibrated model parameters and the existence of unpredictable factors in the settlement of every case.
Appendix: Damages Assumptions
- The Plaintiff-style damages are the product of “damages per share” and “damaged shares”
- Damages per share during the class period are computed as the difference in purchase price inflation and sale price inflation.
- price inflation is computed using the sum of the disclosure-days’ excess dollar returns.
- Price inflation is assumed to be a constant dollar inflation. Constant dollar inflation is a constant dollar amount between the disclosure dates.
- Excess dollar returns (i.e., price changes adjusted for market and industry effects) are computed based on a market model regression using S&P 500 Index (market index) and S&P 500 Biotechnology Index (industry index).
- Damages per share for shares sold after the end of the class period are based on the following assumptions:
- Without the 90-day Lookback Cap: Damages per share are difference between the purchase price inflation and the price inflation at the end of the class period ($0).
- With the 90-day Lookback Cap: As stipulated in the regulation, the damage per share is the smaller of (a) and the difference between the purchase price and the average price over a period of at most 90-days following the class period.
- Damaged shares are computed via multi-trader model:
- The model counts the number of damaged shares, subject to assumptions, from institutional holdings data.[19]
- The model applied a 2-trader trading model for the non-institutional holdings.
Footnotes:
“In any private action arising under this chapter in which the plaintiff seeks to establish damages by reference to the market price of a security, if the plaintiff sells or repurchases the subject security prior to the expiration of the 90-day period described in paragraph (1), the plaintiff’s damages shall not exceed the difference between the purchase or sale price paid or received, as appropriate, by the plaintiff for the security and the mean trading price of the security during the period beginning immediately after dissemination of information correcting the misstatement or omission and ending on the date on which the plaintiff sells or repurchases the security.” 15 U.S. Code § 78u–4 – Private securities litigation ↑
A similar effect is discussed also in J. Schreiber and J. Tschirgi (2020), “Market Rebound May Curb Securities Class Actions, Damages”, Law360, July 31, 2020. ↑
Bharat Bhole, Sunita Surana. & Frank Torchio (2020), “Benchmarking Market Efficiency,” 2020 U. Ill. L. Rev. Online 96. While the paper uses data up to 2018, the 3-year measurement periods provide some credibility to the benchmark values. ↑
Cammer v. Bloom, 711 F. Supp. 1264 (D.N.J. 1989). ↑
Cammer v. Bloom, 711 F. Supp. 1264 (D.N.J. 1989). ↑
Barber, Brad M., Paul A. Griffin, and Baruch Lev. “The fraud-on-the-market theory and the indicators of common stocks’ efficiency.” J. Corp. L. 19 (1993): 285. ↑
Cammer v. Bloom, 711 F. Supp. 1264 (D.N.J. 1989). ↑
Cammer v. Bloom, 711 F. Supp. 1264 (D.N.J. 1989). ↑
Cammer v. Bloom, 711 F. Supp. 1264 (D.N.J. 1989). ↑
For review of studies on the topic, see Jonathan M. Karpoff, The Relation Between Price Changes and Trading Volume: A Survey, 22(1) J. FIN. & QUANTITATIVE ANALYSIS 109, 121 (1987). See also Chen, Gong-Meng, Michael Firth, and Oliver M. Rui. 2001. The dynamic relation between stock returns, trading volume, and volatility. Financial Review 36: 153–74. ↑
Krogman v. Sterritt, 202 F.R.D. 467, 474 (N.D. Tex. 2001). ↑
Krogman v. Sterritt, 202 F.R.D. 467, 474 (N.D. Tex. 2001). ↑
Krogman v. Sterritt, 202 F.R.D. 467, 474 (N.D. Tex. 2001). ↑
- Again, consistent with our treatment of the holdings of Acuitas Group Holdings LLC, we treat the company as an insider. ↑
Fama, Eugene F. “Efficient capital markets.” Journal of finance 25.2 (1970): 383-417. ↑
In re PolyMedica Corp. Sec. Litig., 453 F. Supp. 2d 260, 276-78 (D. Mass. 2006)) ↑
Dolgoff, Aaron, Duarte-Silva, Tiago, “Measuring price impact with investors’ forward-looking information,” CRA Insights (FM-Insights-Event-Studies-and-Forward-Looking-Information-August-2014.pdf (crai.com)). ↑
Cornerstone Research, “Securities Class Action Settlements: 2023 Review and Analysis”. ↑
There is little institutional ownership in BIVI during the Class Period, not counting insider/strategic entities. So, the results are unlikely to be significantly different if a simpler 2-trader model is used. ↑
